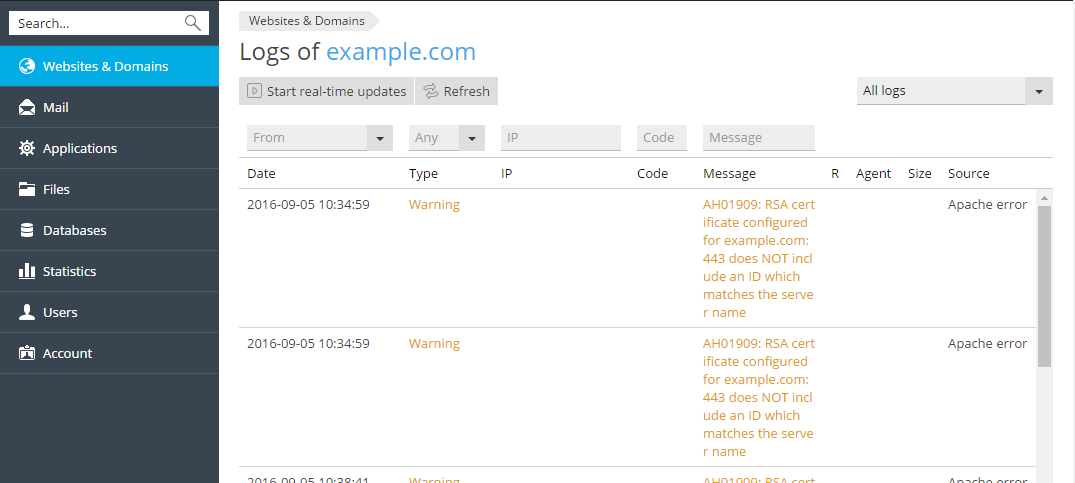
Log Browser assists you in troubleshooting issues with your websites by
parsing the web server logs and displaying relevant warnings and error
messages in the Plesk interface.
On Linux, the information from the following log files is displayed by
default:
- Apache access (access_log). This log records all HTTP requests
processed by the Apache web server. - Apache ssl access (access_ssl_log). This log records all HTTPS
requests processed by the Apache web server. - Apache error (error_log). This log contains diagnostic information.
It also records any errors that the Apache web server encounters in
processing requests. - nginx access (proxy_access_log). This log records all HTTP requests
processed by the nginx proxy web server. - nginx ssl access (proxy_access_ssl_log). This log records all HTTPS
requests processed by the nginx proxy web server. - nginx error (proxy_error_log). This log contains diagnostic
information. It also records any errors that the nginx proxy web
server encounters in processing requests.
On Windows, the information from the IIS log is displayed. This log
records all requests processed by the web server, both HTTP and HTTPS,
as well as any errors that the web server encounters in processing
requests..
In addition, you can add any custom log file from you web site directory
to track it in the Log Browser, as described below.
Access Log Browser
To access the Log Browser, go to Websites and Domains > Logs.
You will be presented with a list of messages gathered from the logs. By
default, the Log Browser displays messages present in the monitored logs
at the moment of opening. If you want to refresh the list with messages
added after opening the Log Browser, click Refresh. Alternatively,
if you want to have new messages continuously added to the list, click
Start real-time updates.

To select the logs from which you want to view messages, click the
 icon, and select the desired logs from the menu.
