Grafana


Version
1.6.5
Requires
18.0.53
Developer
Plesk
Category
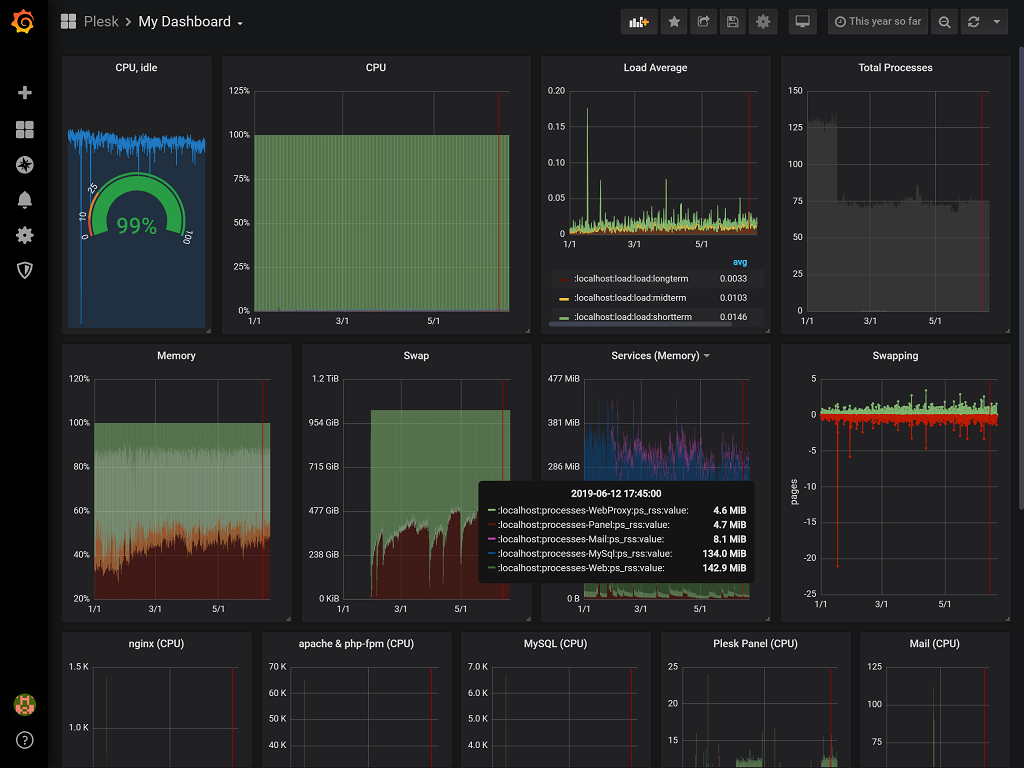
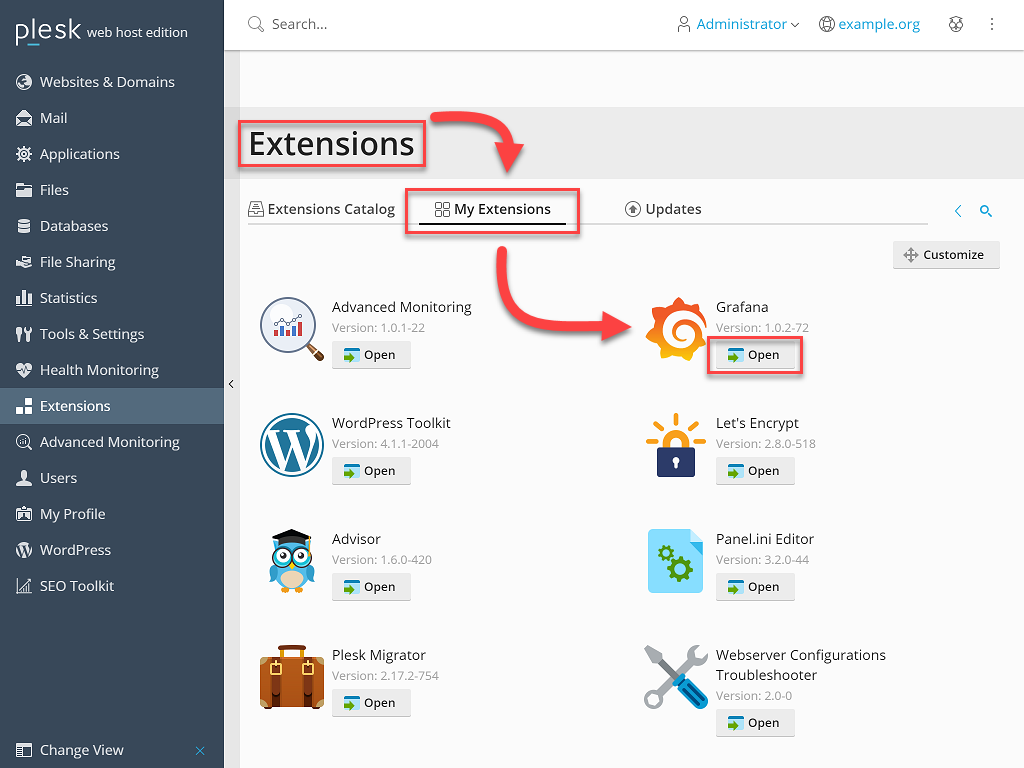
The extension offers integration with Grafana, the leading open source software for time series analytics. Grafana displays data in numerous types of graphs and dashboards, which are highly customizable and visually appealing.
You can use Grafana in two ways:
- Use Grafana with the data collected from default sources, which were integrated for you by the Plesk team. Currently the default source is the Advanced Monitoring extension, which collects server health metrics.
- If you an experienced Grafana user, you can harvest data from any source that you can integrate with Grafana. To integrate other data sources with Grafana, grant the Grafana administrator the write permission.
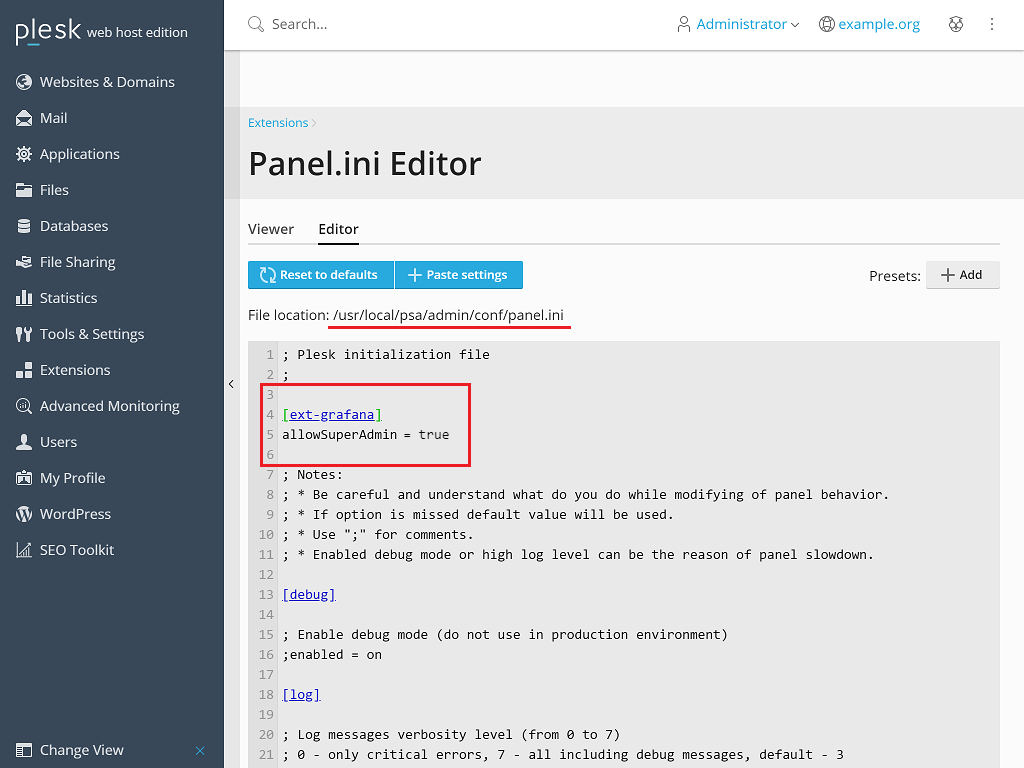
To grant the Grafana administrator the write permission:
-
Add the following lines to the
panel.inifile:[ext-grafana]
allowSuperAdmin = true
-
Go to Grafana, hover over the administrator name, and then click Sign out.
You will be signed out and at once automatically signed in. You can now integrate Grafana with data sources of your choice.
