As they say, there are three kinds of lies: lies, damned lies, and statistics. We need not concern ourselves with the former, but the latter might be of interest; specifically, statistics in Parallels Plesk. On the surface, the concept appears to be simple enough – it does not take a rocket scientist to figure out that it is about crunching numbers pertaining to the disk and traffic usage on a server – but the particulars are relatively obscure. This article aims to give an in-depth, “under the hood” overview of how statistics generation works in Plesk, highlight potential issues, as well as provide some troubleshooting advice.
In a nutshell, the statistics mechanism in Plesk calculates disk space and traffic usage on a per domain basis. This information is available to end users, resellers, and the provider alike. Besides being purely informative, statistics calculation indirectly facilitates other functions, such as the automatic suspension of subscriptions that go over the configured resource usage limits.From the mechanical standpoint statistics calculation is handled by the statistics utility, which is being evoked by a script scheduled to run on a daily basis. On Linux, the following cron job takes care of the task:
# install_statistics
/usr/local/psa/bin/sw-engine-pleskrun /usr/local/psa/admin/plib/DailyMaintainance/script.php >/dev/null 2>&1
Look for it in /etc/cron.daily/50plesk-daily. On Windows, it is the task with the description of “Daily script task” in the Task Scheduler. This ‘Daily maintenance’ script wears many hats (suspending subscriptions that overuse resources, checking for Plesk updates etc), and running the statistics utility is one of them. For every domain, the utility does the following, in turn:
- Calculates disk usage and writes it to the Plesk database. The information goes into the disk_usage and domains tables.
- Parses mail and FTP logs to calculate SMTP/POP3/IMAP/FTP traffic usage for the domain.
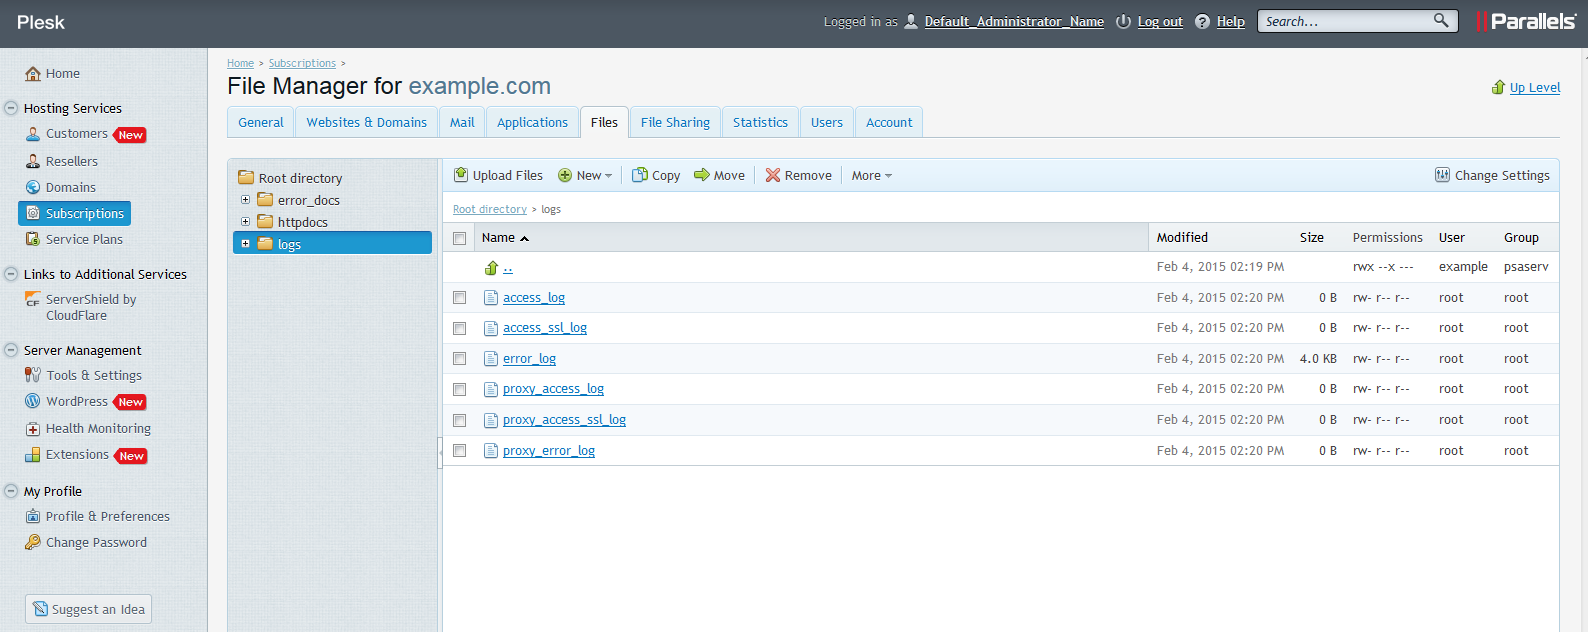
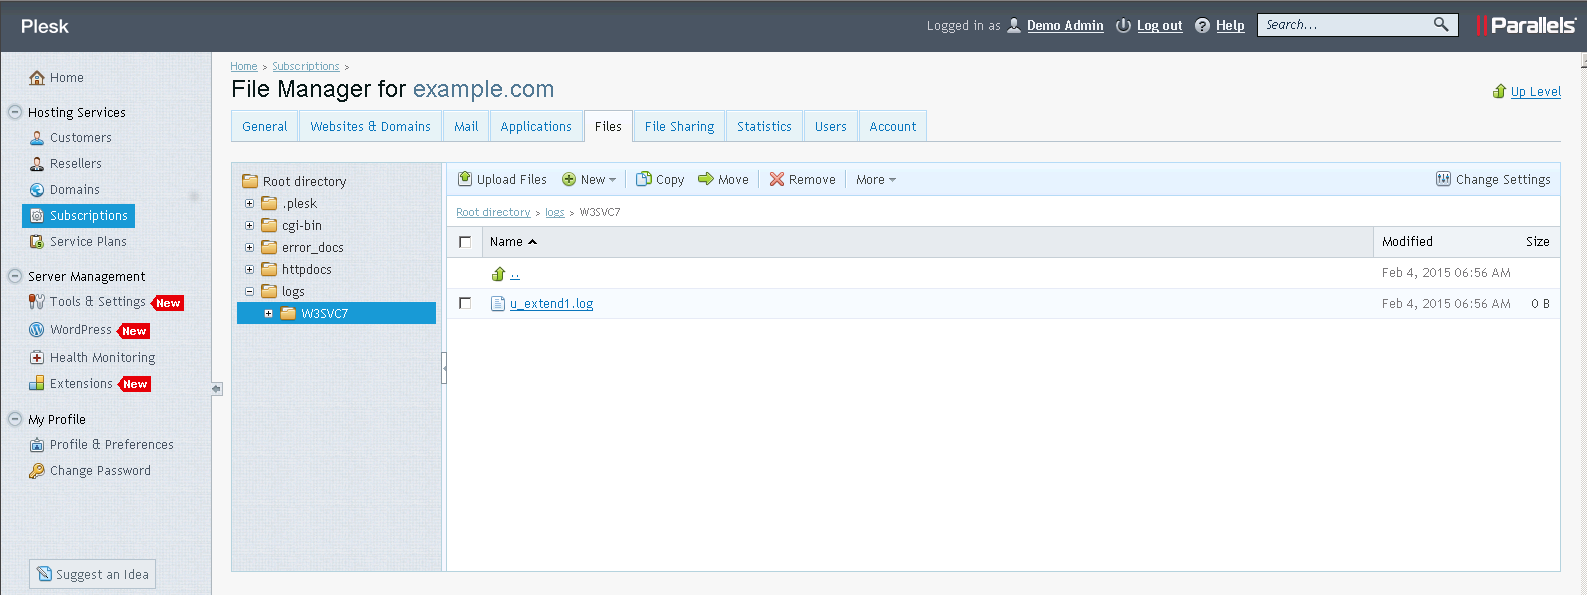
- Processes the data from the web server logs. Now this is where the magic happens, so let us first take a look at the log files we will be talking about. Any user can see their domains’ web server logs from the Plesk interface by using the built-in file manager.
Here is where the web server logs are located on Linux:
And on Windows:
On Linux the processing of the Apache logs consists of the following steps:
- The statistics utility reads the data from access_log, proxy_access_log, access_ssl_log, and proxy_access_ssl_log files and writes it to the corresponding *_log.stat and *_log.webstat files (i.e. the data from access_log and proxy_access_log goes in access_log.stat and access_log.webstat, and the data from *_ssl_log files goes in access_ssl_log.stat and access_ssl_log.webstat).
- It then writes the data from the *.stat files into the corresponding *.processed files (e.g. the data from access_log.stat goes into access_log.processed), then sorts the contents. The *.stat files are removed afterwards.
- Parses the *.processed files to calculate web server traffic, then calls the logrotate utility which cleans up the *.processed logs according to the domain’s log rotation settings. Note that this explains why there aren’t any provisions for rotating individual access log files in the logrotate configs (found in /usr/local/psa/etc/logrotate.d/<domain.tld>) – they never grow to any noticeable size, as the information is moved to .processed logs and those are rotated instead.
- Creates hard links in the $HTTPD_VHOSTS_D/<domain_name>/logs/ directory pointing to the actual logs stored in $HTTPD_VHOSTS_D/system/<domain_name>/logs/. This mechanism allows end users to see the logs for their domain(s) and manage them, but prevents Apache from going haywire if a user deletes the /logs directory in their webspace, which Apache will be unable to recreate, as the directory is owned by root:root.
- Writes the acquired traffic data to the Plesk database (DomainsTraffic and ClientsTraffic tables).
- Calls the web statistics engine (either Webalizer or AWstats, depending on the domain’s settings). It processes the .webstat files to generate an HTML representation of the traffic data, available for the customers in the Web Statistics menu, then erases the contents of the .webstat files.
On Windows the process is much more straightforward. When the time comes to work on the web server logs, the statistics utility does the following:
- Calculates traffic based on the data in the IIS log and writes it to the Plesk database.
- Writes the time it ran to the registry.
- Generates a different log and a configuration file. Those will be used by the web statistics engine (Webalizer or AWstats). The generation of web statistics is handled by a scheduled task named “Daily web statistics analyzers run task”, and the temporary log is removed after statistics calculation is done.
The next time the utility is run, it references the registry to get the date and the time it was last executed, then processes the data in the IIS log that has accumulated since that time, writes it to the web statistics log, and so on. Log rotation on Windows is carried out by the standard IIS means, so it does not depend on the utility running.
In the ideal world the process goes smoothly every time. Regrettably, in the imperfect reality the statistics engine requires a fair chunk of memory to operate, and is a juicy target for the OOMkiller. If the statistics utility is terminated before it has processed web server logs for all domains, those domains whose web server logs have not been processed will not have them rotated either (as there will be no .processed logs to rotate). This is a conscious design decision – this way we ensure that the data in the web server logs is not lost – but the trade-off is that the logs directory can quickly grow to an intimidating size, so the provider should keep an eye out for end users’ disk usage values ballooning, especially for domains seeing a fair amount of traffic.
Troubleshooting issues with statistics boils down to the following steps. These are by no means exhaustive, but provide a solid starting point, and should cover most everyday situations:
- Make sure that the logs are there for the affected domain(s). By default, the logs are located in $HTTPD_VHOSTS_D/system/<domain_name>/logs/ (Linux), or %plesk_vhosts%\<domain_name>\logs\<logs_directory> (Windows). Make sure that permissions on the log files directory and the log files themselves are correct.
- Make sure that the scheduled task calling the daily maintenance script is in place. Make sure that it is being run (the cron daemon may be down etc).
- Make sure that the statistics utility is present and operational. Try running it for a single domain.
If you have trouble with log rotation, try these steps:
- Make sure that access logs are being correctly marked as .processed by the statistics utility (Linux). Make sure that the log rotation settings defined in the panel match those set in IIS proper (Windows).
- Make sure that the scheduled task calling the daily maintenance script is in place. Make sure that it is running (the cron daemon may be down etc).
- Make sure that the logrotate utility is present and operational. Try running it for a single domain (Linux).
Finally, some useful reading:
- Here is what directories are tallied when disk usage is calculated: http://download1.parallels.com/Plesk/PP12/12.0/Doc/en-US/online/plesk-administrator-guide/71164.htm#
- Here are links to the documentation describing statistics calculation in Plesk:


No comment yet, add your voice below!